Carbon Eye
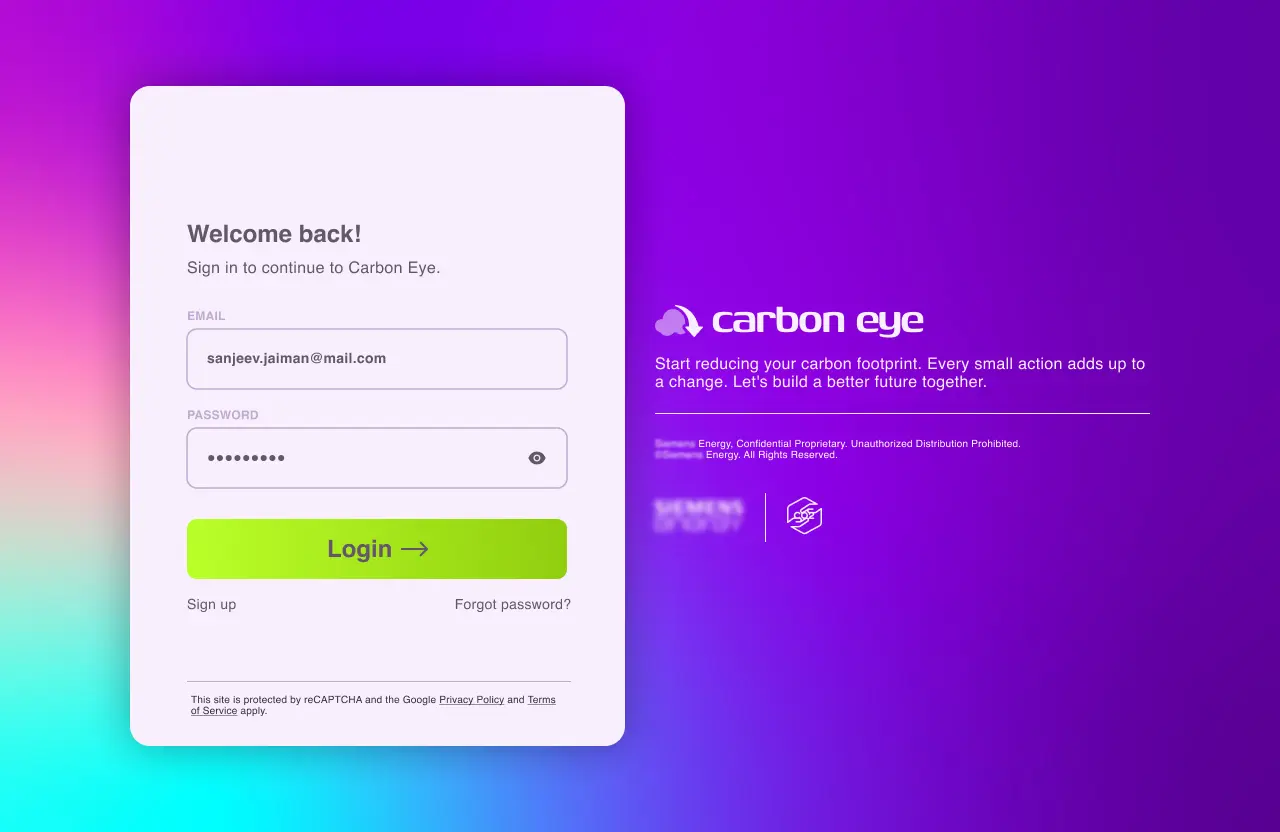
Due to a current non-disclosure agreement (NDA), access to the visual materials and specific details of this project is restricted.
Product
Web App
Year
2023
Industry
Electric utility
Disciplines
- UX Strategy
- UX/UI Design
Product
Web App
Year
2023
Industry
Electric utility
Disciplines
- UX Strategy
- UX/UI Design
Requirement
The requirement was to design a dashboard that would assist any type of organization in their efforts to reduce their CO2 emissions to meet industry standards, comply with government mandates, or fulfill internal corporate social responsibility standards.
Challenges
The primary challenge of the project was to determine the sections of the web app. To achieve this, we conducted qualitative research complemented by quantitative industry data. After listing the proposed sections, we worked as a team on an affinity diagram to group the sections and establish their hierarchy. We also reviewed insights extracted from the data with which we opened the possibility of exploring other monetization methods.
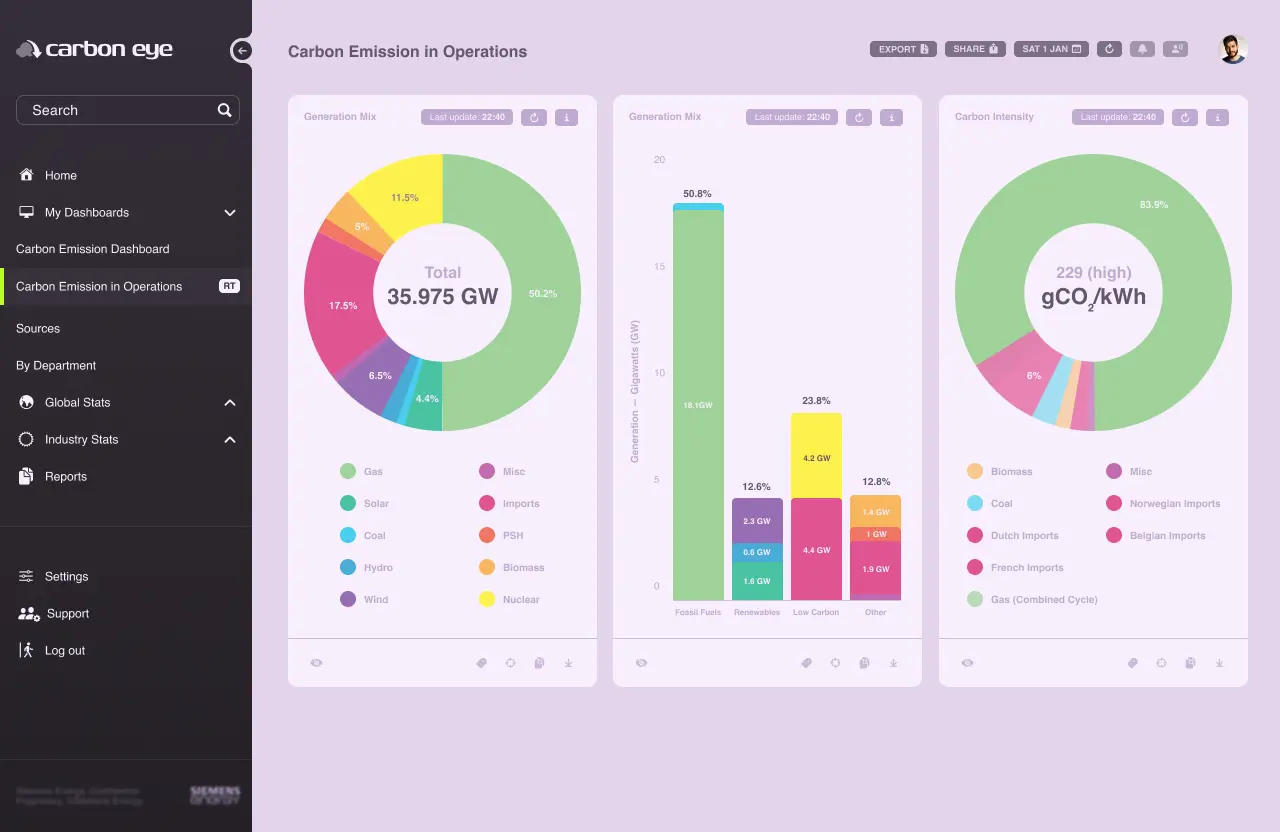
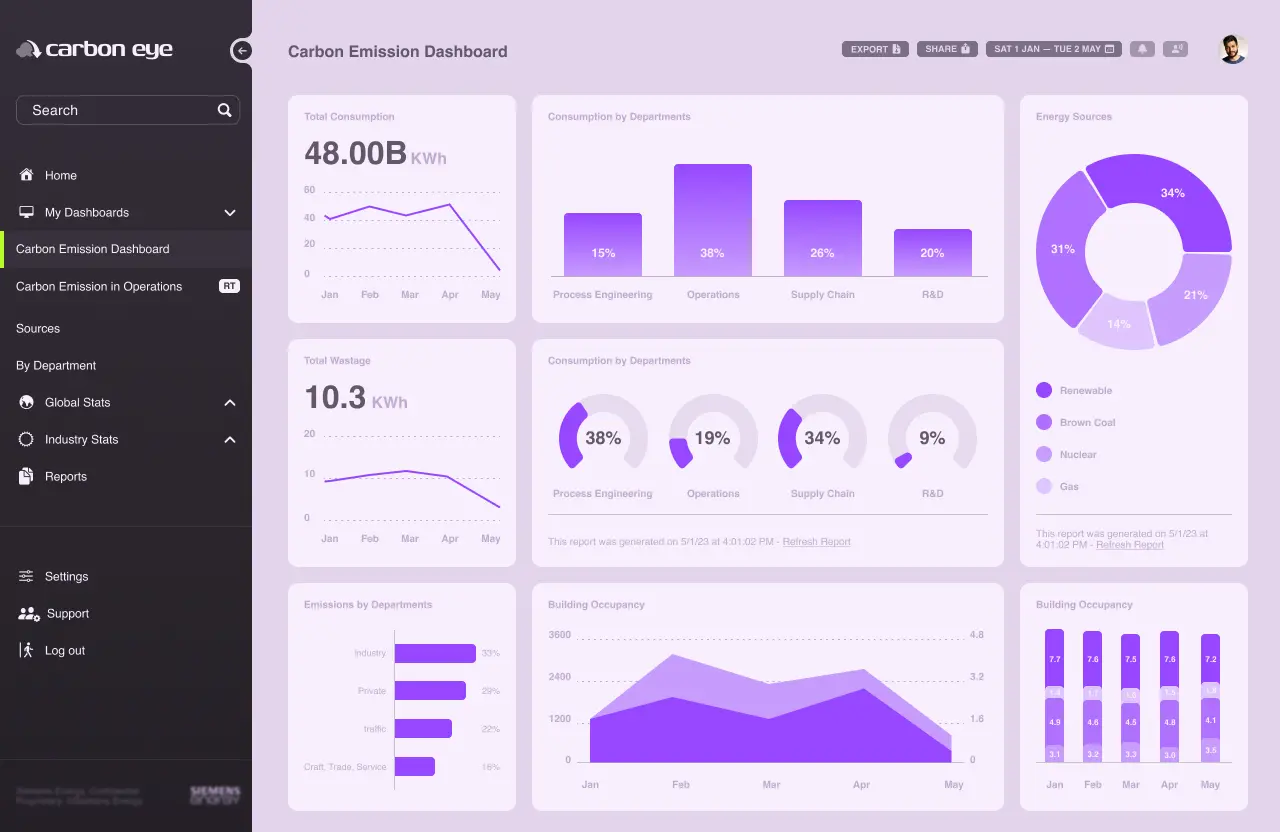
Another significant challenge was conceptualizing the main dashboard, for which it was first necessary to establish which metrics indicators were the most relevant based on qualitative data and which of these represented a standard applicable to any type of organization.

Results
The dashboard included the following functionalities:
- Dashboard and widget configuration (how to display information)
- Data source configuration
- Real-time indicator dashboard
- Grouping of indicators by department and others
- Repository of external sources to visualize data from different types of industries and normal distributions
- Report generator
- General web app settings
- Access to real-time support

