Organizations need to monitor CO₂ emissions and meet standards or CSR goals, but indicators and sources are complex and fragmented.
Strategy
Define a universal dashboard via research and industry data: configurable views, source setup, and reporting.
Impact
A launch-ready concept with defined sections, indicator hierarchy, and configurable dashboards—validated by stakeholder reviews (no post-launch data).
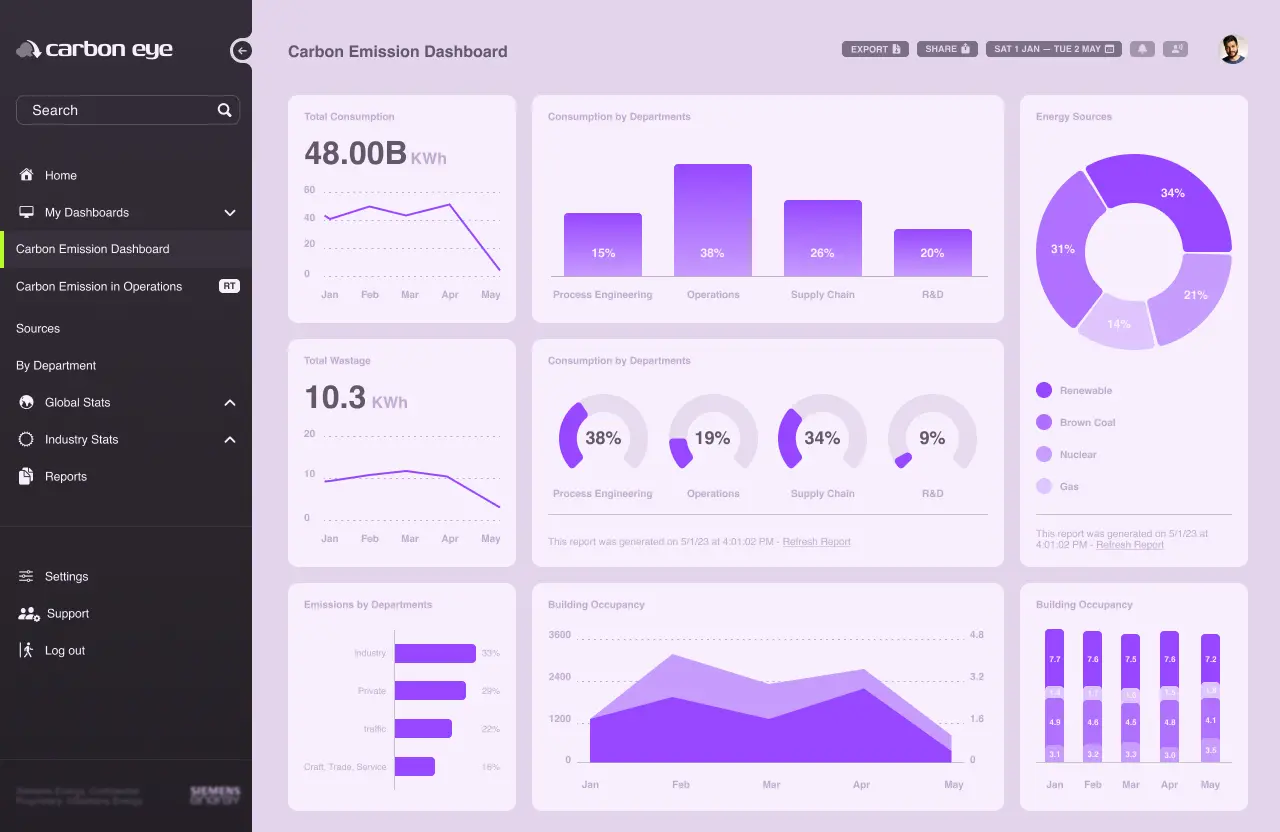
A summary dashboard makes total consumption, sources, and department breakdowns comparable at a glance.
Design Decisions
Key Decision 1
Establish the app sections and hierarchy first (dashboards, sources, reports, settings) to keep the system navigable as it scales.
Key Decision 2
Design a universal “core indicators” model that works across organization types, then allow grouping by department and context.
Key Decision 3
Make configuration a first-class workflow (widgets, sources, reporting) so teams can adapt views without rebuilding the product.
Solution
Solution 1
Configurable dashboards with widget patterns for totals, trends, and source composition.
Solution 2
Indicator grouping by department and a repository of external sources for cross-industry comparisons and distributions.
Solution 3
Report generation, general settings, and access to real-time support as built-in operational capabilities.
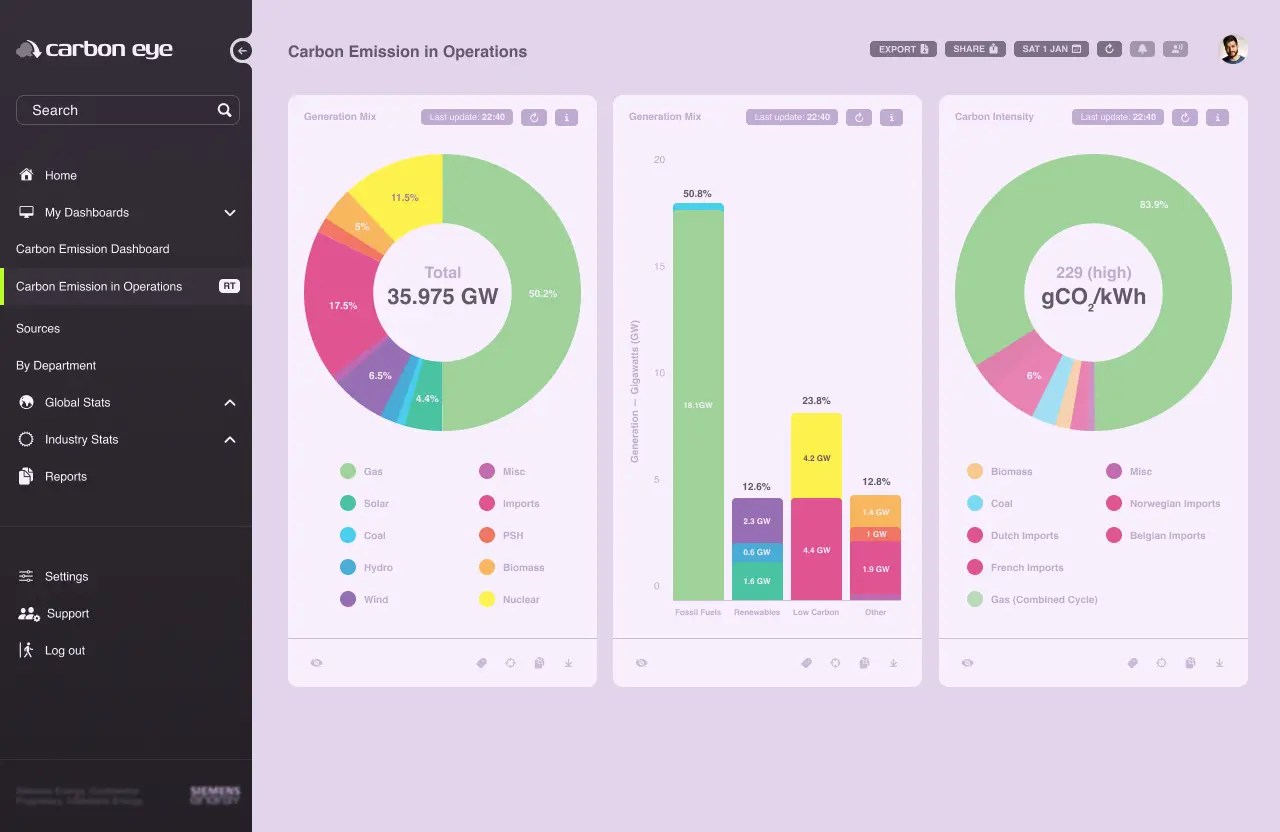
Operational views connect generation mix and carbon intensity, supporting monitoring and day-to-day decision-making.
Results
Results
Delivered a complete UX structure and dashboard concept, including configuration flows, real-time indicator views, grouping by department, and reporting capabilities.
Results Method
Validated through qualitative research + industry data synthesis and stakeholder alignment; visuals and specific details restricted by NDA.
A branded access point sets the tone and supports a consistent experience across the application.
Systemization
A repeatable widget and chart pattern set (totals, trends, composition, comparisons) to keep dashboards consistent across contexts.
Information architecture rules for sources, departments, and reports to prevent fragmentation as modules expand.
What I'd Do Next
Define an event/measurement plan for dashboard usage, report generation, and configuration adoption to guide iteration post-launch.
Add anomaly cues and threshold-based alerts to help teams detect emission spikes and data-quality issues faster.
Define an event/measurement plan for dashboard usage, report generation, and configuration adoption to guide iteration post-launch.
Add anomaly cues and threshold-based alerts to help teams detect emission spikes and data-quality issues faster.
Credits
Executive sponsor and subject-matter stakeholders (operations/energy), collaborating through research synthesis and design reviews.
NDA / Alias Notes
Due to a non-disclosure agreement (NDA), access to additional visuals and specific implementation details is restricted.
Tags
Platform UX, Sustainability, Data Visualization, B2B Dashboard, Reporting
Next case
Green Box
Electricity procurement configurator that turns engineering constraints into assisted setup and real-time monitoring to reduce CO₂ impact.